Simon P. Tsaoussisa, W. Andrew Chenga, Ronnie Appelsb, and Robert E. Parksc
aKostaCLOUD Inc., 5795 Commerce Lane, South Miami, FL 33143, USA
bTucson Optical Research Corp., 210 S Plumer Ave, Tucson, AZ 85719, USA cOptical Perspectives Group LLC, 7011 E Calle Tolosa, Tucson, AZ 85750, USA
ABSTRACT
We propose a realistic model for tolerancing ofscattered surface manufacturing defects(MSF, and Scratch-Dig-like specifi cation) based on physical insights gained in developing a new scatter theory (FRTS) based on first principles and Maxwell’s equations.
Keywords: FRTS, Scratch-Dig, Mid Spatial Frequencies, MSF, Scatter
1. INTRODUCTION
Modeling realistic optical surfaces in the context of tolerancing of an optical design is challenging. Typically, Zernike terms or aspheric terms are used to represent tolerances for macroscopic surface form errors. While this kind of tolerancing is a reasonable approximation for form error, it offers little information about surface scatter from small tooling marks which are represented by quantities like Scratch-Dig specifications and MSF content for SPDT freeform optics. Fourier Rayleigh Tsaoussis Scatter (FRTS) theory was developed out of a need to understand the impact of Near Angle Scatter phenomena within the context of NASA’s Habitable Worlds Observatory (HWO) to contrast levels beyond 1010. The main goal of this theory is to minimize assumptions and to be able to accurately predict BRDF based on realistic surface characteristics and develop engineering models to provide predictive character of surfaces. We use this model to account and characterize surface scatter characteristics and determine the impact on realistic system PSF and MTF based on ray tracing
The basic FRTS theory, as proposed in the NASA SBIR, is as follows for a given sinusoidal pitch and amplitude:
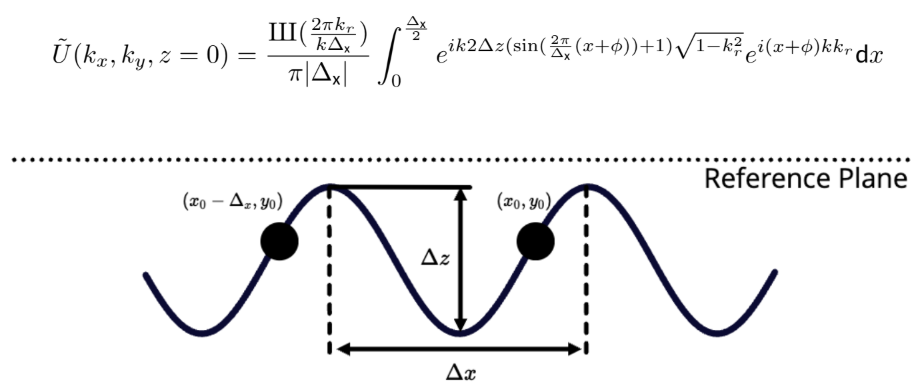
Figure 1. FRTS basis element for scatter
The reference plane is given as the offset from which light must propagate for every sinusoid to account for relative phase errors for each spatial frequency. A series of these can be computed together via convolution theorem and inte grated to give us a full frequency spectrum for a given PSD. This effectively allows us to calculate ensemble effects for all spatial frequency content. Below, we show a reproduction of the classic table that Harvey has used to illustrate the various ways to represent a surface.
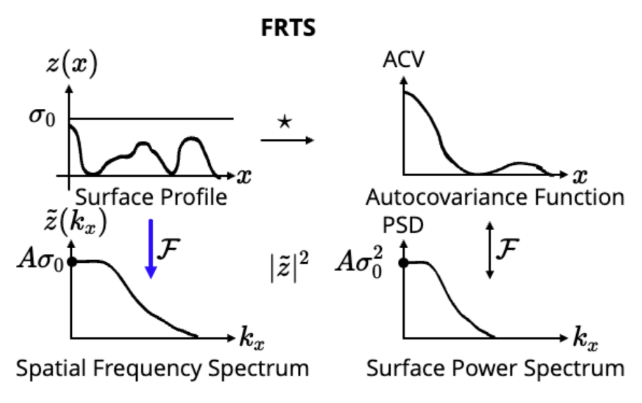
Figure 2. FRTS’s most important quantity, which defines scatter functions, is given by the spatial frequency spectrum rather than the surface power spectrum, which allows us to account for amplitude and relative phase for a given spatial frequency
2. MODELING MID SPATIAL FREQUENCIES
Mid Spatial Frequency (MSF) content comes from sub-aperture tool paths. If the reader has seen a milled part and seen the lines left over on a milled surface finish, this is identical to what is left over in a sub-aperture polish toolpath. These toolpaths can be modeled based on an influence function for a given toolpath.
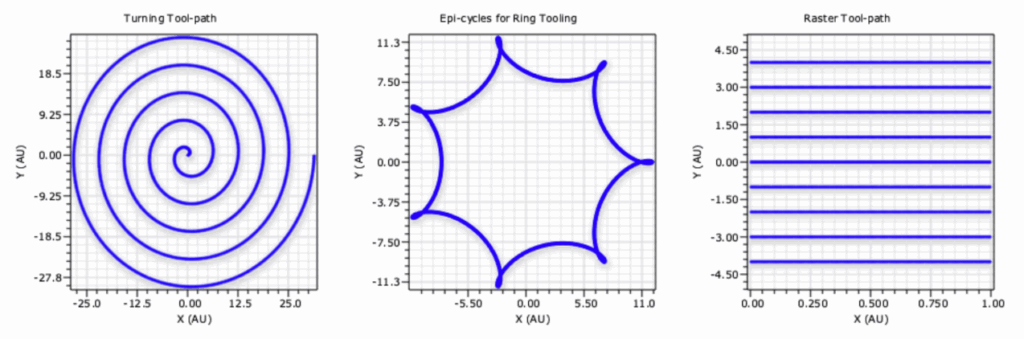
Figure 3. Sub-Aperture Tool Paths. Left. Turning tool path, Mid. Epi-cycle toolpath, Right. Raster Tool Path
The next piece of information needed is the tool influence function. This is required in order to take our 1D parametric curve, which defines the toolpath, and turn it into a 3D sag. To do this, we looked at a dwell function for an MRF machine from Li et. al.1and calculated its integral along itself vertically, as this is the direction of movement along the toolpath as shown below.
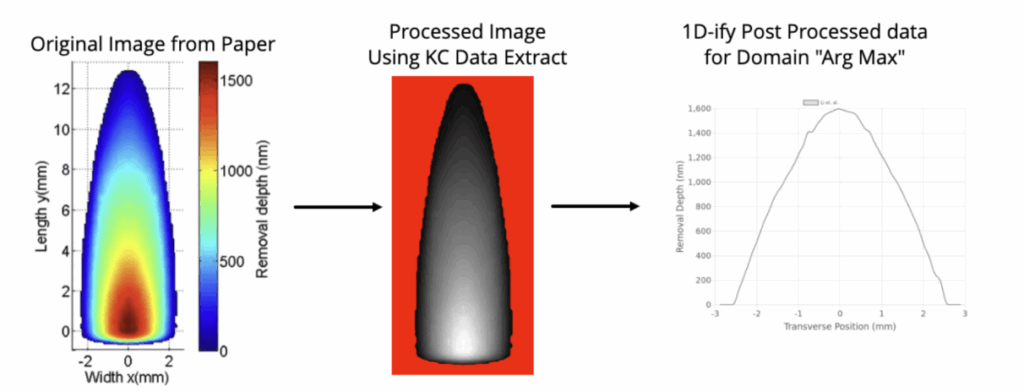
Figure 4. Processing of Tool influence function from 2D data to 1D cross section. Original Image from Paper1Li et. al.
Next, we can take this toolpath and take the arg-min path integral to get the total MSF contribution for a given optic. In Fig. 5, we show the contribution of the tool influence function on the toolpath.
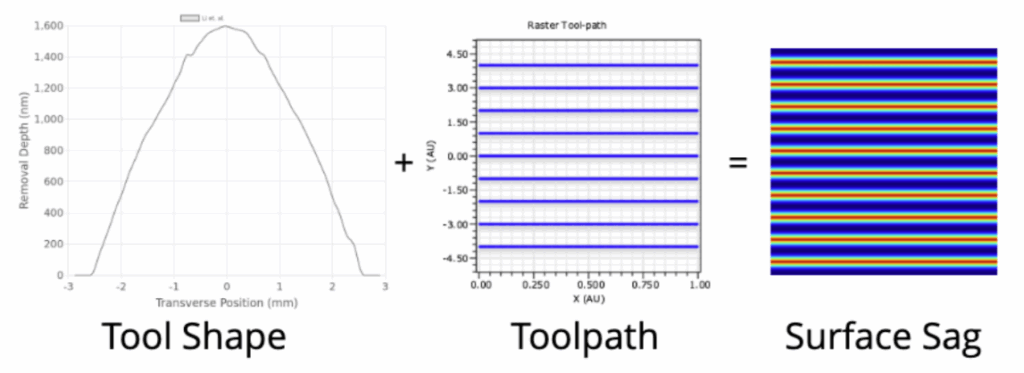
Figure 5. Tool influence function flow and contribution to the surface Sag
We also show a turned spiral toolpath example below with the PSD. Note how nice the modeled spiral toolpath sag surface looks; real toolpaths also include chatter, among other higher-order effects. These can be effectively modeled with coupled ODEs, but this is beyond the scope of this paper.
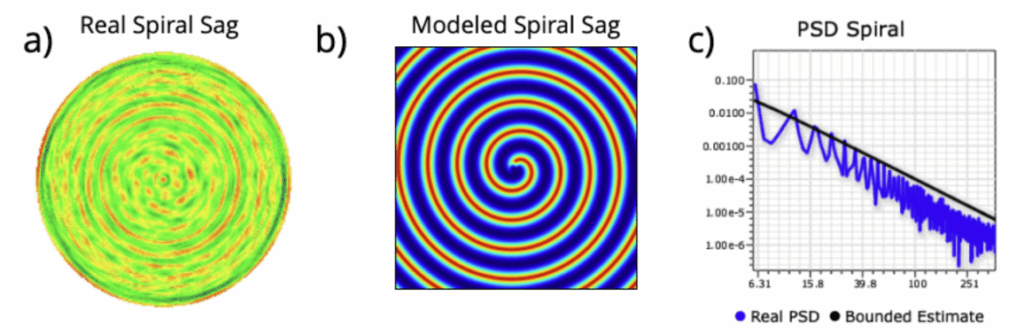
Figure 6. a) Real surface MSF sag from Aikens et. al. for spiral toolpath2b) Simulated MSF for a spiral pattern c) Simulated MSF spiral PSD
3. MODELING MSF IN KOSTACLOUD OPTICAL DESIGN SOFTWARE
Now that we know how MSF can be modeled, we can use this information in KostaCLOUD Optical Design Software (ODS). We used KostaCLOUD Optical Design Software version 2025.8.3 to calculate tooling models for MSF tools. We used a model Cooke Triplet example to demonstrate MSF impact on image quality for tolerancing of optical systems.
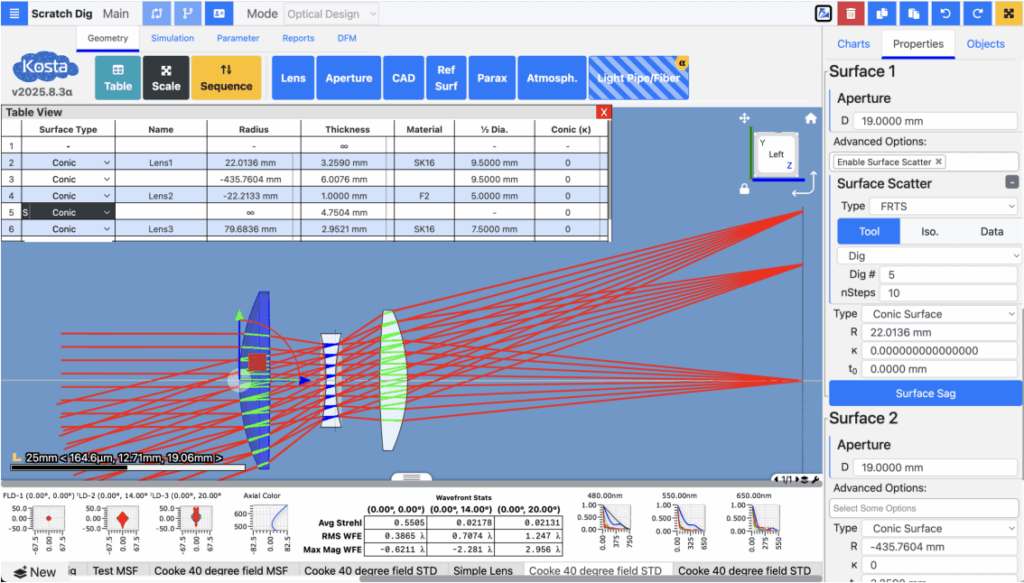
Figure 7. Triplet used in analysis as shown in KostaCLOUD Optical Design Software (ODS)
To start, we demonstrate introducing MSF into this Cooke triplet, where there is a 0.5mm tool stepover, 2mm effective tool width, and a 50nm tool depth. This MSF reduces the Strehl ratio in half and decreases image quality as expected. We also provide the impact on the MTF, and one can see that the MTF is slightly impacted, with the most significant impact occurring at 550nm.
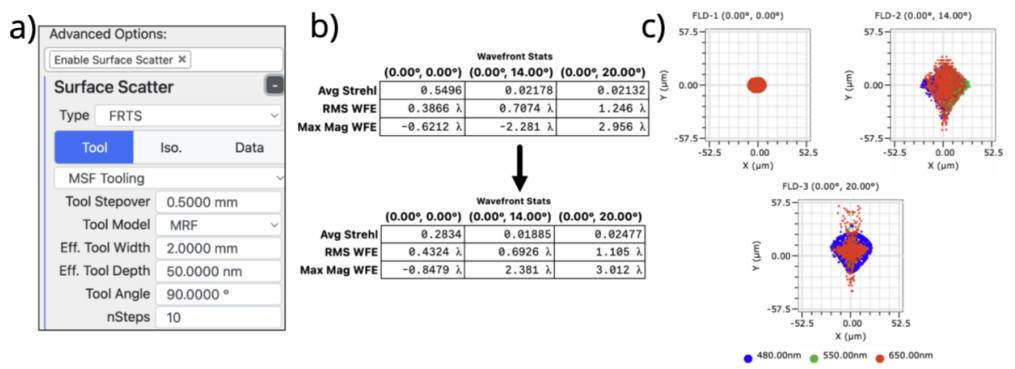
Figure 8. a) Settings in KostaCLOUD Optical Design Software (ODS) b) Wavefront statistics for nominal (top) vs MSF surface (bottom) c) Spot diagrams with MSF surface.
Now we demonstrate an extreme case of MSF. We have a tool stepover of 500µm, an effective tool width of 2mm, and an effective tool depth of 1.5µm. We can see that this acts more like a grating where colors separate much more, and the MTF drops off significantly. We apply this to all six surfaces in the Cooke triplet.
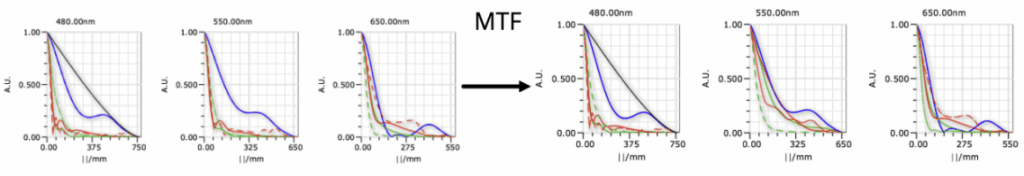
Figure 9. MTF impact for MSF surface on a surface. 550nm has the largest impact of the three wavelengths
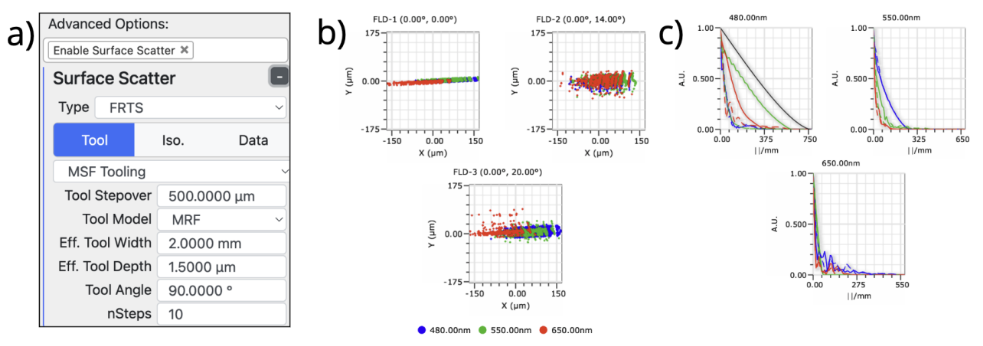
Figure 10. MSF impact for significant MSF content. a) KostaCLOUD ODS surface Scatter Settings b) Spot Diagrams with MSF contributions c) MTFs with MSF contributions
4. SCRATCH-DIG
Now we will discuss a Scratch-Dig. We were interested in characterizing lots of scratches and digs to build an optical model. At Tucson Optical Research Corp., we took a scratched-up flat and various high-quality optics to quantify Scratch Dig radiometrically. After creating this database, we can then model the impact of individual scratches and digs and calculate their PSDs. We measured interferograms of each of these scratches to get the geometry information for each individual scratch in terms of width and depth. From there, we take these PSDs and put them into FRTS and calculate the scattered field.
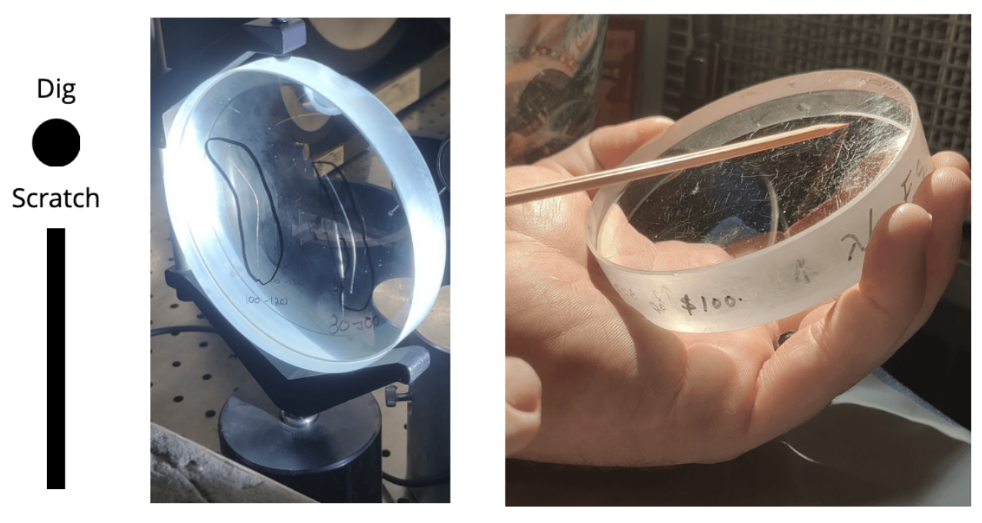
Figure 11. left) long scratches with brightnesses of 100-120 and 80-100 right) scratched up surface for demonstration purposes

Figure 12. a) Real 60-40 surface b) Scratched up surface c) PSD of scratched up surface showing expected slopes as predicted by FRTS
After we built this database, we determined the impact of these scratches on MTF, as the spot diagram for all intents and purposes does not change. The simulation for the scratch dig model is for a single scratch taking up the entire scratch budget or a single dig taking up the entire dig budget. Something that is interesting that we are interested in exploring further in real systems is that, according to our ray model, it seems that a small modulation is added on the MTF for scratches but not digs. Below we have an example of a 40 scratch impact on the previously shown Cooke Triplet and a 20 dig on the right. For the next set of plots, we show a 10 Scratch and a 10 Dig surface, where the MTF is practically unchanged, as expected.
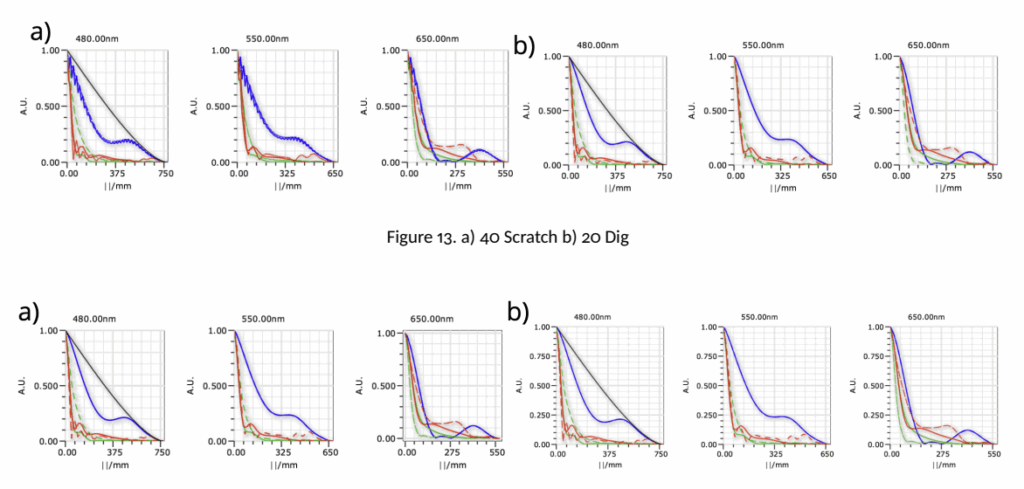
Figure 14. a) 10 Scratch b) 10 Dig
5. CONCLUSION
We successfully used KostaCLOUD ODS FRTS capability to model the impact of MSF and Scratch-Dig. We have successfully demonstrated modeling the origination of MSF by modeling the tool path and directly link it to processes in optical manu facturing. Additionally, we successfully demonstrate a tool for modeling scratch-dig impact on optical performance. Both of these methods in turn provide useful guidance in proper specification and tool selection in tolerancing and finishing of optical systems.
ACKNOWLEDGMENTS
This is work based in part on NASA SBIR Phase I – S12.03-1011. The authors would like to thank H. Philip Stahl and David Smith from NASA Marshall Space Flight Center for their contributions and insight throughout the FRTS model development process.
REFERENCES
[1] Li, L., Zheng, L., Deng, W., Wang, X., Wang, X., Zhang, B., Bai, Y., Hu, H., and Zhang, X., “Optimized dwell time algorithm in magnetorheological finishing,” The International Journal of Advanced Manufacturing Technology 81, 833–841 (May 2015). [2] Aikens, D., DeGroote, J. E., and Youngworth, R. N., “Specification and control of mid-spatial frequency wavefront errors in optical systems,” Frontiers in Optics 2008/Laser Science XXIV/Plasmonics and Metamaterials/Optical Fabrication and Testing (2008).