How well can the Point Source Microscope (PSM) find a point in space?
A POTENTIAL CUSTOMER FOR A PSM RECENTLY ASKED “WHAT IS THE ACCURACY/REPEATABILITY OF ALIGNMENT OF OPTICAL AXIS?”
The question is a little ambiguous as to exactly what he was asking for, but my own experience in the lab is that the PSM with a 10x microscope objective can locate a center of curvature or the axis of a Bessel beam to a small fraction of a micrometer.
However, I wanted to give him a more specific answer than my own experience and had to think where the supporting data could be found.
Then I remembered a paper from 3 years ago with data taken by a graduate student at UNC-Charlotte, Jesse Groover. Jesse, whose advisor was John Zeigert, had set up a PSM in a metrology lab looking at an Axicon grating on a Moore Tool Universal Measuring Machine.
THE POINT SOURCE IN THE PSM CREATES A BESSEL BEAM IN REFLECTION FROM THE AXICON GRATING WHEN THE POINT SOURCE IS ON A NORMAL NEAR THE CENTER OF THE GRATING.
If the PSM is centered precisely on the normal to the center of the Axicon grating, the Bessel beam bright core will lie on the origin of the PSM detector. Jesse took repeatability measurements at 3 distances from the grating to see how well the PSM could locate the center of the Bessel beam.
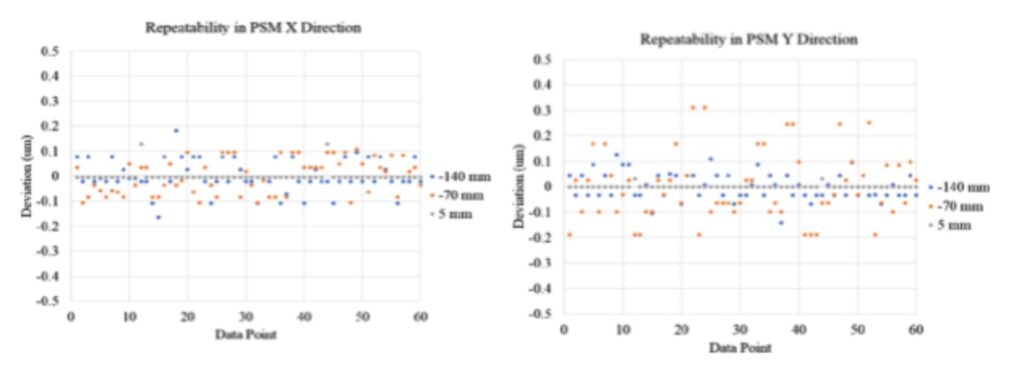
THE DATA HE TOOK IS SHOWN IN THESE TWO CHARTS.
When the PSM is very close to the grating (5 mm) there is almost no deviation from zero. At greater distances there is some deviation presumably due to air turbulence, but in all cases the repeatability is limited to ± 0.3 μm verifying my anecdotal lab experience.
The paper goes on to say “The repeatability of the PSM was evaluated by mounting it on a Moore UMM located in a well-controlled environment. This machine is highly stable with vibrational disturbances and axis positioning repeatability on the nanometer level.
The PSM was focused on the axicon CGH at distances of 5, 70 and 140 mm from the surface, and readings were taken at 10 second intervals over a period of 10 minutes. It can be seen that the PSM measurements are repeatable to within a few tenths of a micron.
Measurements were also taken by jogging the machine away from the initial position and back multiple times. The results are virtually identical, and consistent with the nanometer level positioning repeatability of the Moore UMM.”
THE PAPER CITED IS “COMPUTER GENERATED HOLOGRAMS AS 3-DIMENSIONAL CALIBRATION ARTIFACTS”
A copy of the full paper is available for download here on the Optical Perspectives Group website and can be accessed by registered users with the button immediately below.
If you have not already registered, do so. Then you have access to all the papers on the website about the PSM and optical testing in general under the Bibliography tab. The registration page is here.
GET MORE FUNCTIONALITY FROM YOUR PSM BY SAVING LARGE SAMPLES OF DATA
In the PSM Align software there is a means of saving the locations of up to four x, y spot locations at a time as a part of the Threshold tab.
Once the spots are individually tagged with the cursor, their x, y locations, as seen on the Threshold tab, can be saved to a .csv file.
While this is a handy feature, some users might wish for a method of saving spot locations as an object is scanned, or saved over a time period when doing a drift test to see how alignment changes with temperature changes in the lab.
All you have to do is ask us and we will send a link to upgrade your software, gratis (see below).
LCS-PSM ALIGN SOFTWARE
As you are probably aware, Optical Perspectives sells a centering station with a vertical column that moves the PSM up and down the optical axis of the system being aligned.
As a part of that operation the LCS-PSM Align software saves the spot and vertical column locations to a .csv as the stage moves.
This software is not supplied with the purchase of just a PSM because there is a bit of a learning curve getting familiar with the PSM.
However, once familiar with the PSM and software it is not much of a jump to take advantage of the LCS-PSM software.
While the software is designed to synchronize the spot location data with the movement of the Centering Station stage, the software is written in a way that it can be fooled to take data points at constant time intervals. This means that if you want to monitor the drift in alignment it is possible with the LCS-PSM software.
SYNCHRONIZE YOUR DATA
Further, while the software was meant to be synchronized with a stage motion, since it takes data at a constant time interval, if you have a scanning system that operates at a constant velocity, the software will take data as though it were synchronized.
This means that scan data can be saved without going through all the coding compatibility issues to do true synchronization.
Just start the LSC-PSM scan and then start your independent but constant velocity scan. The software will create a file of x, y spot location versus time.
After transferring the PSM .csv file to Excel or similar software, you can turn the time base into distance scanned and have a graph of spot position versus distance.
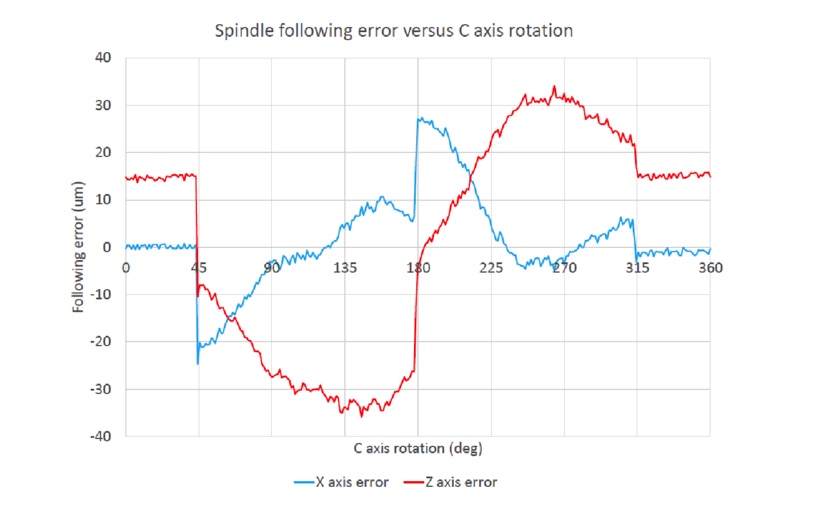
THIS GRAPH IS AN EXAMPLE OF DATA TAKEN THIS WAY.
In this chart the LCS-PSM scan was started at 0 degrees while the table rotation was started at 45 degrees and stopped at 315 degrees and then the PSM software scan was stopped at 360 degrees.
It is clear the table was not moving from 0 to 45 degrees and ended it rotation at 315 degrees because the spot motion ceased except for a little noise at the sub-μm level.
While the table was rotating there is a continuous plot of the small following error between the point on the table and the tool motion that was supposed to follow the table rotation.
There is also clear evidence of a shift at start up and shutdown as well as possible backlash as the follower changed directions.
This type of scanning information is easily gathered by the PSM following a high quality steel ball at the focus of the PSM objective.
It does not require compatibility between machine tool and PSM software. The only requirement is that the scan motion run at a constant velocity so the time base is easily converted to a distance, or angle as in this case.
HOW TO OBTAIN THE LCS-PSM SOFTWARE
If you have an application where you would like to use your PSM to follow a constant velocity motion or drift over time, use the form below to ask and we will send you a link to the LCS-PSM software.
NOTE: The PSM part of the software is identical to what you already have, the new part enables the captures of scan data versus a time base.